SYNOPSIS
Over the last decade, competitive electricity providers in retail choice jurisdictions have performed far better than their monopoly utility peers in containing and reducing the cost of electricity. Since 2010, average prices in retail choice jurisdictions have remained essentially flat in the residential sector and have dropped dramatically in the commercial and industrial sectors, whereas rates in monopoly utility jurisdictions have increased substantially over that period. Nevertheless, absolute prices in competitive states, which started the study period well above those in monopoly states, remain comparatively higher, although the gap has narrowed considerably. Prices in competitive jurisdictions continue to drop, and there is good reason to believe that that trend will accelerate in the future, as lower-cost renewable resources displace coal- and gas-fired generators to an ever-greater degree.
THE EMERGENCE OF RETAIL CHOICE OF ELECTRICITY SUPPLIER
Starting in the mid 1990s, several states began exploring the potential of restructuring their electricity industries to "unbundle" electricity generation (power plants) from electricity delivery (transmission and distribution). By that time, experience with the small-scale generators promoted by the Public Utility Regulatory Policies Act [1] and the emergence of a new generation of gas-fired combined cycle power plants had demonstrated that electricity generation was no longer a "natural monopoly," [2] thereby eroding the chief historic justification for regulating it as such. It was becoming clear that, at least in some parts of the country, the growing ranks of independent power producers could offer electricity at lower cost than the incumbent monopoly utility. This new reality was reflected in a number of changes in federal regulation of the electric industry, which ultimately enabled the formation of competitive wholesale markets for electricity (sales between utilities and from independent power producers to utilities). Competitive wholesale markets, in turn, opened the door for competitive retail markets (sales from competitive suppliers to end-use customers).
There are many excellent resources that describe the process of electricity restructuring in the United States. [3] We will not linger on that history here, except to state that following a somewhat bumpy start in the late 1990s, the group of 13 states depicted in Figure 1 plus the District of Columbia have persisted to the present day in providing all consumers with access to a retail market consisting of numerous electricity suppliers who compete with each other for customers on the basis of price and a variety of other service attributes (such as the proportion of renewable energy in the generation mix). In the remainder of this paper, these 14 jurisdictions are referred to as "retail choice" or "competitive" jurisdictions, whereas the remaining 37 states that have retained the vertically integrated, traditional cost-of-service regulation model are referred to as "monopoly" jurisdictions. [4]
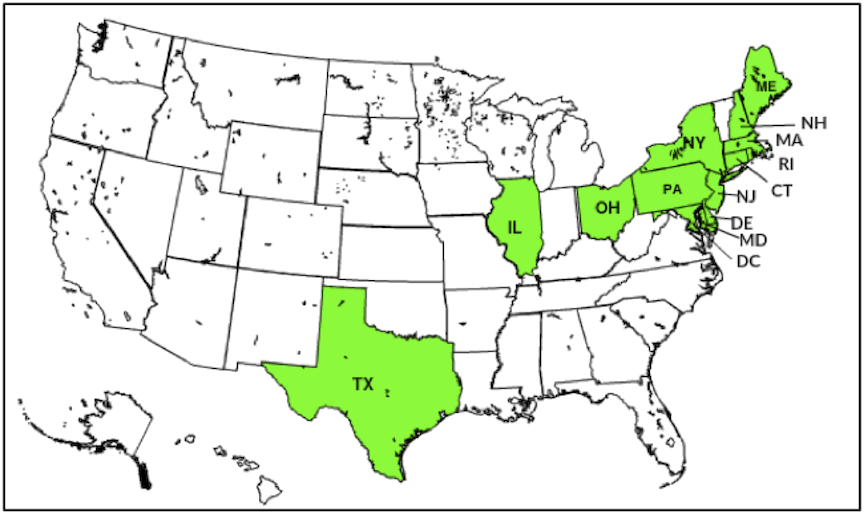 Figure 1. Retail Choice Jurisdictions in the U.S.
THE COMPETITIVE EDGE
One of the most common questions that arises in discussions about retail choice for electricity – meaning competition between multiple electricity suppliers rather than a single, monopoly utility – is some form of: "How has competition affected the price of electricity?" Anyone with a basic understanding of economics would guess that competition would put downward pressure on commodity prices, and it turns out that that's also true for electricity.
Figure 2, which is based on data from the U.S. Energy Information Administration (EIA), [5] demonstrates very clearly that residential electricity rates in competitive states have been on a distinctly different trajectory than rates in monopoly states since at least 2010.
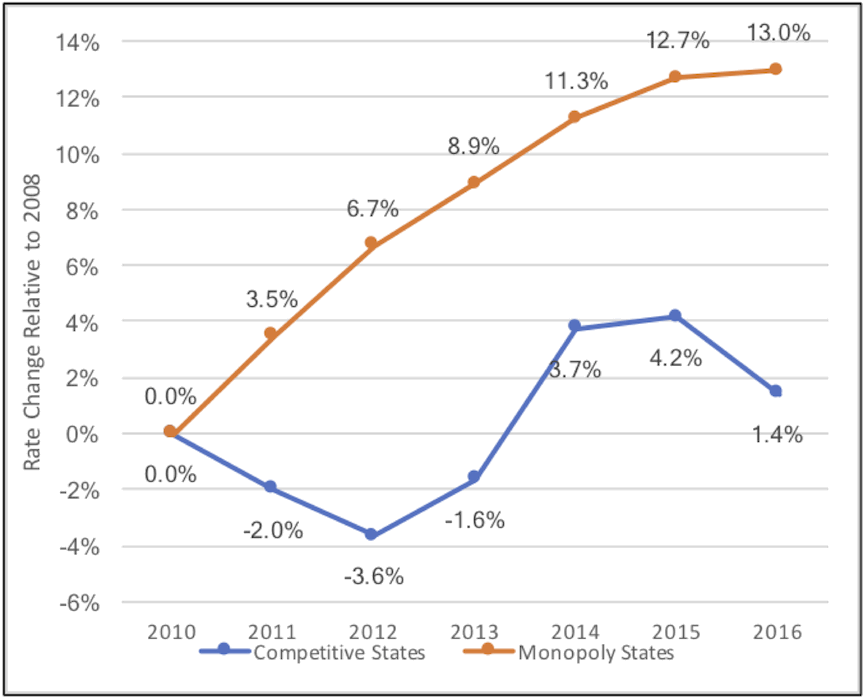 Figure 2. Residential Percentage Price Change relative to base year 2010 in Competitive states (blue) vs. Monopoly States (orange), over the time period 2010 to 2016.
The average residential electricity rate in monopoly states rose continuously between 2010 and 2016, and was nearly 13 percent higher in 2016 (in nominal dollars) than it had been six years earlier. In contrast, residential rates in competitive states were essentially flat and varied by at most 4 percent during that time period.
Figure 3 demonstrates that commercial and industrial rates in monopoly states increased substantially, though more slowly than residential rates, between 2010 and 2016, while in competitive states the average rates in these sectors declined dramatically during this time period.
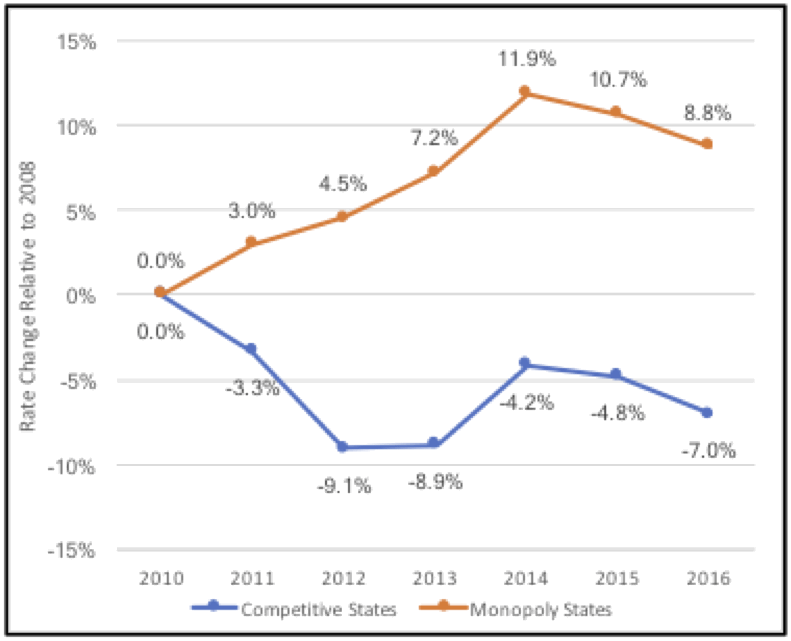
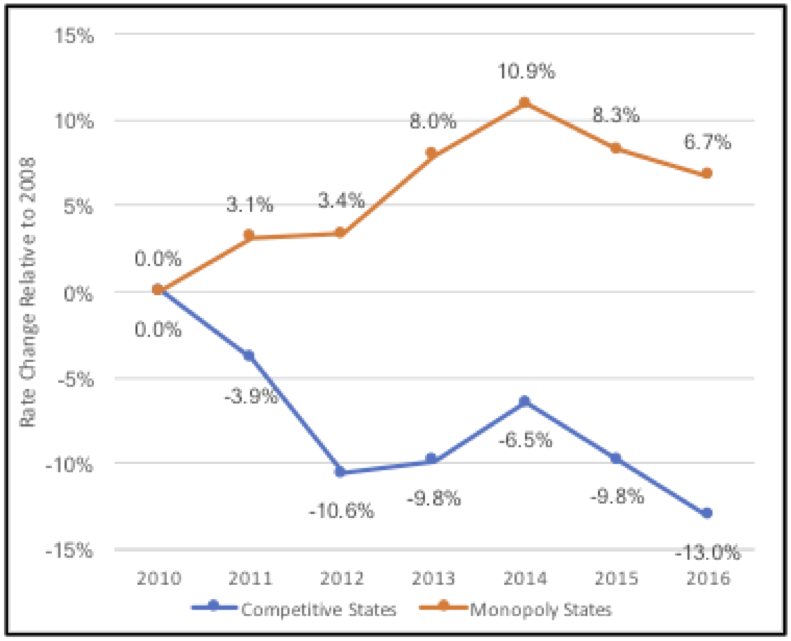
Figure 3. Commercial (left) and Industrial (right) Price Change relative to base year 2010 in Competitive states (blue) vs. Monopoly states (orange), over the time period 2010 to 2016.
To summarize, while residential, commercial and industrial electricity rates in the monopoly states rose by 13%, 9% and 7% respectively between 2010 and 2016, in the competitive states the average residential rate rose less than 2% and the commercial and industrial sectors saw reductions of 7% and 13% respectively over the same time period. Competition has done exactly what we would expect from economic theory: it has driven down electricity prices. Considerably. The competitive forces unleashed by retail choice in the competitive jurisdictions have resulted in electricity rates considerably lower than they likely would have been had these states not restructured their electricity markets.
In his recent review of electricity restructuring in the U.S., Philip O'Connor, former chair of the Illinois Commerce Commission, notes that: [6]
"The divergence in price trends between the group of states that have incorporated competitive markets and the group that has remained under monopoly regulation is neither accidental nor aberrational. It is a function of entirely different public policies that prescribe quite different ways in which supply prices are set and risks are borne.
"Traditional regulation sets supply prices on the basis of past capital investment and current costs of operation, with little regard for the actual economic value of the product. In competitive markets, supply prices are set by the dynamics of supply and demand.
"The problem for consumers served by monopoly utilities in the flat-load era is not merely one of poor risk allocation. Traditional regulation necessarily sends inaccurate price signals. Because traditional rate setting is in great part retrospective, prices will tend to be set too high in periods of surplus in order to recover investment in power plants that are producing less power than anticipated. Similarly, traditional regulation distorts price signals, including setting prices too low in periods of impending shortage and too high in periods of surplus. This upside-down pricing is resulting in rising prices in monopoly states at the same time customers are restraining their electricity consumption from the grid. In choice jurisdictions, all customers have a clear line of sight to the economic value of electricity in wholesale markets. Price signals constitute some of the most valuable information for all stakeholders in a market. Accurate and timely price signals elicit efficient consumer and investor decisions. Poor price information encourages inefficient behavior."
MOVING IN THE RIGHT DIRECTION
The charts above do not show the actual electricity rates in competitive and monopoly states, only how rates have changed over time in percentage terms.
Figure 4 illustrates the ratio of the average competitive-state electricity rate to the average monopoly-state rate over time for each of the three sectors. For instance, a ratio of 110% in 2011 indicates that rates in competitive states were 10% higher than rates in monopoly states in that year.
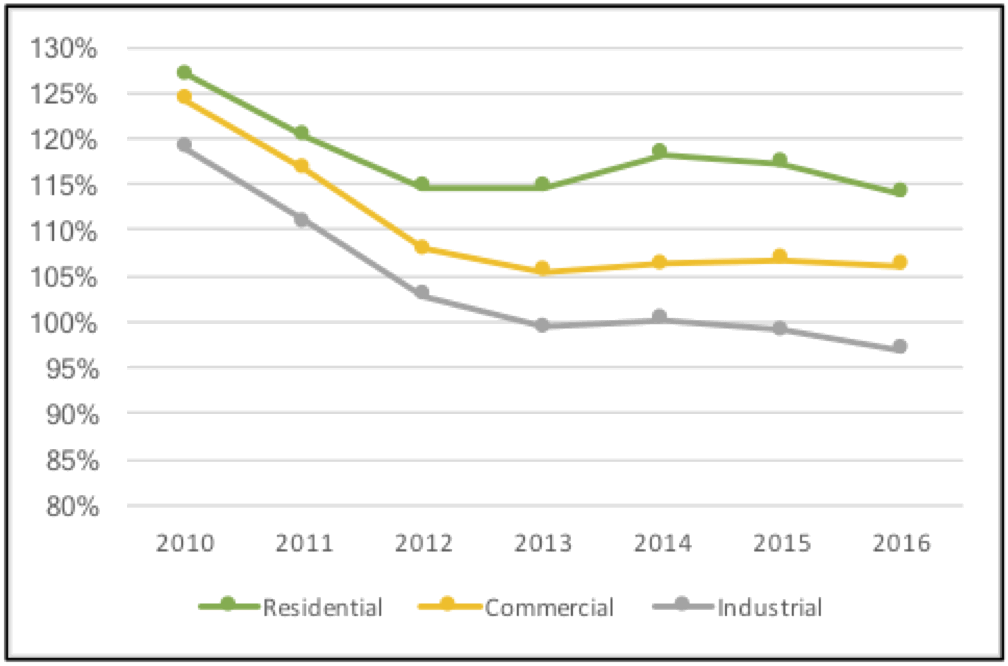 Figure 4. Ratio of Competitive to Monopoly Rates for the residential (blue), commercial (orange) and industrial (gray) sectors, over the time period 2010 to 2016.
While the rate ratios have decreased over time, they have mostly remained above 100 percent throughout the time period, indicating that although rates in competitive states have been steady or declining since 2010, they remain higher than the average rates in monopoly states (except for the industrial sector in recent years).
If electricity costs more in competitive states than monopoly states, why would a monopoly state consider restructuring their electric industry? That's a fair question. To answer it, we need to take a closer look at the history of electricity prices in individual states, both before and after they implemented competitive retail markets.
PRE-EXISTING CONDITIONS
Figures 5 and 6 present the rate history since 1990 for the 14 states that have fully implemented retail competition, [7] compared to the average rate history for all monopoly states over the same time period. One thing that is immediately clear from Figure 5 is that almost all of the competitive states that have residential rates higher than the average monopoly rate had higher rates since well before retail competition began. In other words, rates are higher in the competitive states for structural reasons that have nothing to do with restructuring, such as constraints on fuel supply (for example, natural gas in New England states), or high legacy costs (for example, nuclear power plants in New York). This points to one of the primary reasons that states have historically chosen to restructure their electricity industries: their electricity prices are high, making life harder for consumers, and making their industries less competitive. The governments of states with particularly high electricity prices feel the most political pressure to restructure, and so they were some of the earliest states to embrace restructuring, and subsequently to benefit from the downward pressure on rates caused by competitive market forces.
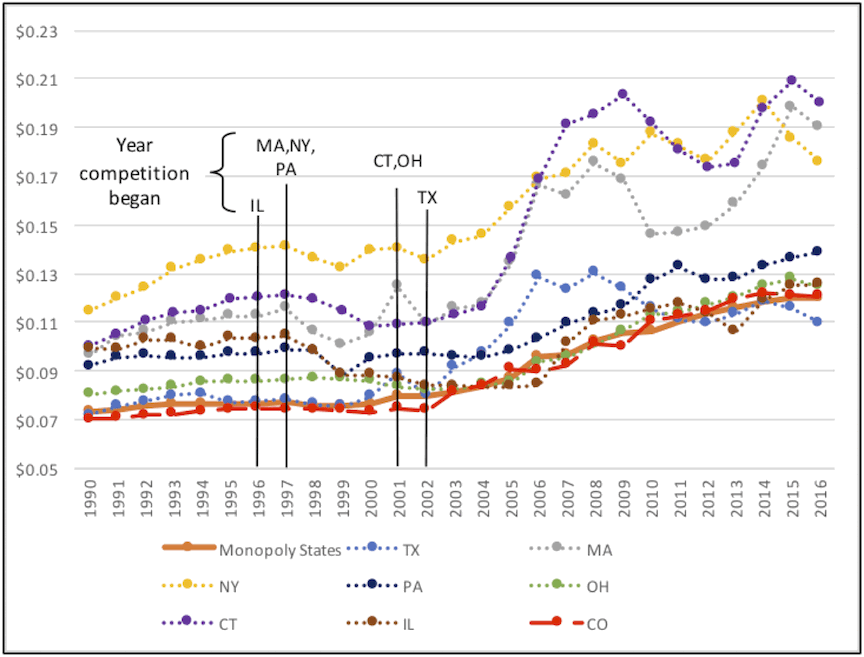 Figure 5. Residential rate history, 1990 to 2016 in selected competitive states in comparison to the average residential rate in monopoly states (orange). Vertical lines indicate the year in which competitive sales began in each state's residential sector.
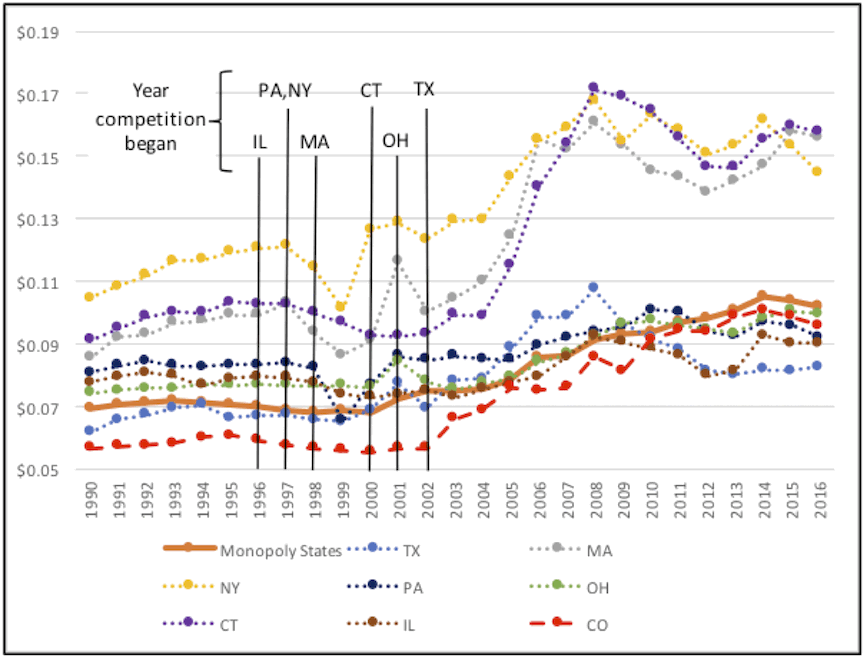
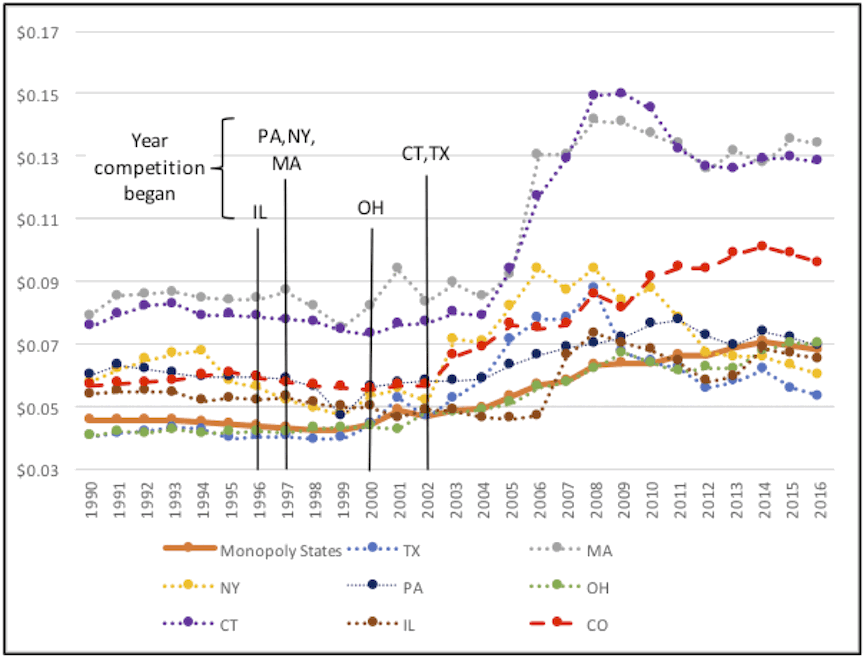 Figure 6. Rate history, 1990 to 2016, in the commercial (top) and industrial (bottom) sectors for select Competitive States in comparison to the average rates in Monopoly States (orange). Vertical lines indicate the year in which competitive sales began in each state's commercial and industrial sector.
Another striking feature of Figures 5 and 6 is the steep rise of rates in Connecticut, Massachusetts and New York starting in about 2003 and persisting through 2016. At least one factor is that the cost of natural gas, a primary electricity generation source in those states, rose sharply beginning in 2003.
As Figure 7 illustrates, natural gas prices to power generators began a steep rise in 2003, contributing to electricity price increases throughout the country. Although gas prices subsequently declined after the 2008 peak, electricity prices in some Northeast states remained elevated. The primary reason for high prices in the Northeast appears to be increasing investments in the region to build and maintain the transmission and distribution systems, and to support public policies. [8,9]
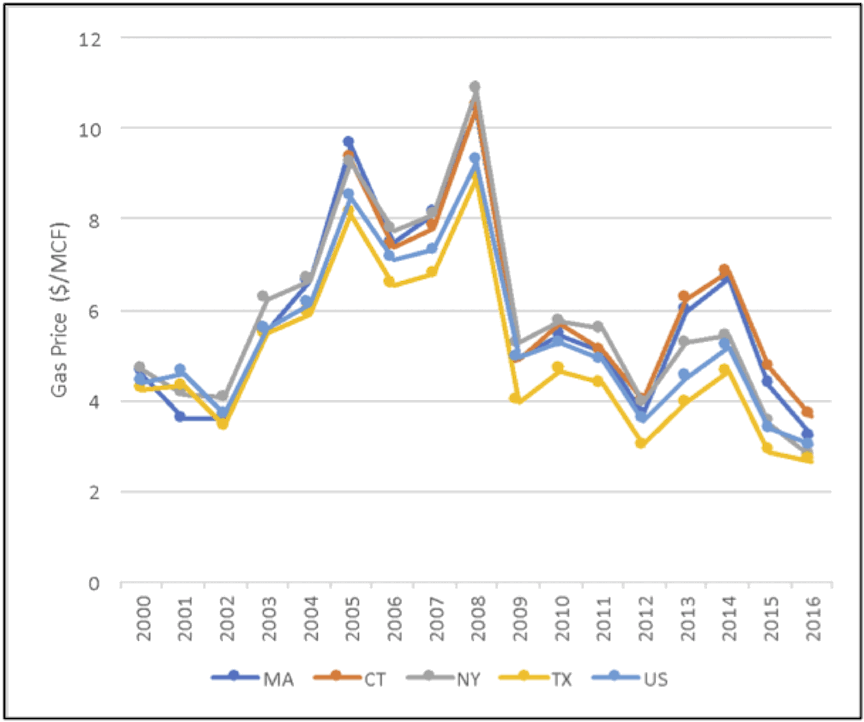 Figure 7. Natural Gas Price to Electricity Generators in select states, 2000 to 2016. [10]
Electricity rates in most other restructured states tended to roughly follow the pattern of natural gas prices after 2008, as exemplified by the experience in Texas. [11] In fully competitive jurisdictions like Texas, natural gas tends to be the lowest-cost energy source and therefore sets the clearing price in the wholesale market. It is an expected characteristic of competitive retail markets that retail prices should reflect the price paid in the wholesale market. Note that consumers in the New England states might very well have experienced the same rate increases had their utilities not been restructured, as utilities in monopoly states pass fuel costs directly through to consumers.
The above analysis indicates that although the electricity prices in many competitive jurisdictions remained above the rates in monopoly jurisdictions through 2016 (particularly in the residential sector), those prices were higher well before electricity restructuring was implemented, for reasons unrelated to the utility model. Prices in competitive jurisdictions have been moving ever closer to those in monopoly jurisdictions since at least 2010, and in recent years competitive prices have begun to drop below the rates charged by monopoly utilities in some states.
But there is good reason to believe that, due to energy technology advances, past trends may not be a good indicator of where competitive retail electricity prices are headed in the future. As the wholesale cost of renewable resources continues to decline (Figure 8), more developers of renewable generation will find it profitable to build new capacity in states with competitive electricity markets, thereby displacing generating resources with higher and more variable fuel costs (such as coal and gas-fired plants) and driving rates down over time. As more and more renewable capacity is built, the decline in competitive electricity prices, relative to prices in monopoly states where legacy assets are generally shielded from economic retirement, is likely to accelerate.
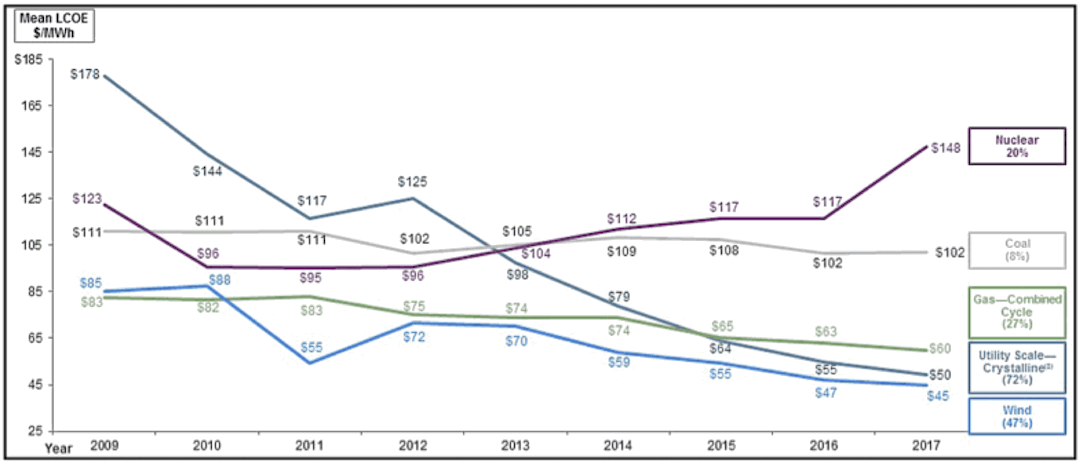 Figure 8. Levelized Cost of Energy, 2009 to 2017 (Average, Unsubsidized). From Lazard (2017). [12]
As rates in monopoly states continue to rise and those in competitive states continue to fall, pressure will build in more and more monopoly jurisdictions to restructure their electric industry.
CONCLUSIONS
Over the last decade, electricity providers in retail choice jurisdictions have been much more successful than their monopoly utility peers in containing and reducing the cost of electricity. Average prices in retail choice jurisdictions have either remained essentially flat (residential) or dropped dramatically (commercial and industrial sectors), whereas rates charged by monopoly utilities have increased substantially. While prices in many retail choice jurisdictions remain higher than those offered by the average monopoly utility, due in large part to higher rates prior to restructuring, that gap continues to shrink and is likely to reverse in the near future. This trend will be accelerated by the expiration of restructuring transition costs (such as "stranded costs" paid to monopoly utilities to compensate them for losses upon restructuring), and by the continuing decline in the cost of wind and solar power. As these trends continue, it seems inevitable that market forces will drive electricity prices in competitive jurisdictions below those of their monopoly peers throughout the U.S., putting pressure on monopoly states to restructure their electricity systems.
NOTES AND REFERENCES:
- See https://en.wikipedia.org/wiki/Public_Utility_Regulatory_Policies_Act - Non-utility_power_producers
- According to businessdictionary.com, a natural monopoly is "a situation where one firm (because of a unique raw material, technology, or other factors) can supply a market's entire demand for a good or service at a price lower than two or more firms can." See www.businessdictionary.com/definition/natural-monopoly.html
- For example, see Electric Restructuring In New England – A Look Back and Restructuring Recharged: The Superior Performance of Competitive Electricity Markets 2008-2016.
- Note that the states of CA, MI, MT, NV, OR, VA and WA have highly-constrained competitive markets. Of these states, only CA has any competition in the residential sector, and even there, it amounts to less than three percent of sales. These seven states also allow modest levels of competitive electricity supply to C&I customers, but 2016 market share was below 20% in all states but MT, where nearly 60 percent of industrial consumption was obtained through a competitive supplier.
- The EIA provides data on utility rates, revenues and sales at this web page: https://www.eia.gov/electricity/data/state/. The authors calculated average rates by dividing total sector-specific revenue in each group (competitive or monopoly) in each year by the total electricity sales for each sector in each group.
- Retail Energy Supply Association, Restructuring Recharged: The Superior Performance of Competitive Electricity Markets 2008-2016 (April 2017), by O'Connor, Philip R., Ph.D., downloaded (February 14, 2017) from https://www.resausa.org/sites/default/files/RESA_Restructuring_Recharged_White Paper_0.pdf.
- Note that only seven competitive states are shown, as including all 14 would have made these figures unreadable. The seven states shown bracket the range of utility rates in competitive jurisdictions.
- See https://www.bostonglobe.com/business/2017/02/28/wholesale-electric-prices-reach-new-low-new-england-but-retail-prices-remain-high/9SB1ASTS7oSAhC2oK0Sr1L/story.html
- See https://www.eia.gov/todayinenergy/detail.php?id=34892
- Source: EIA, https://www.eia.gov/dnav/ng/ng_pri_sum_dcu_nus_a.htm.
- The relationship between natural gas prices and electricity prices is particularly evident in competitive jurisdictions of Texas, as has been documented in the Baker Institute's 2017 report: Electricity Reform and Retail Pricing in Texas. https://www.bakerinstitute.org/research/electricity-reform-and-retail-pricing-texas/
- Levelized Cost of Energy 2017. Lazard (Nov. 2017). https://www.lazard.com/perspective/levelized-cost-of-energy-2017/